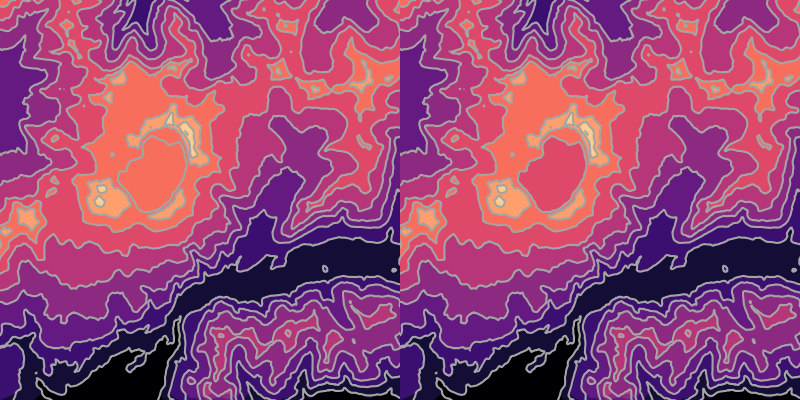
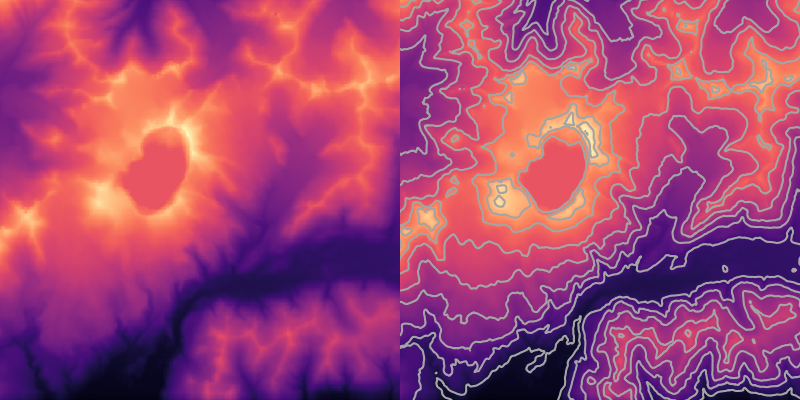
 Left: The topographic raster image used for the examples in this article. It shows the Katmai Volcano in Alaska with the
 magma colour ramp. Right: The same raster, with 200-metre contours added.
We’ll start by illustrating what can be done in QGIS, using a digital elevation model (DEM) of Katmai Volcano in Alaska, downloaded with the SRTM-Downloader plugin. Entering a map extent covering the volcano will download two tiles, which can be merged into a single DEM using Raster > Miscellaneous > Merge. I clip the raster to the area of interest using Raster > Extraction > Clip to speed up the contour calculation.
We can generate contour lines with Raster > Extraction > Contour, which calls an underlying function from the GDAL library. To keep the output simple, I used a 200-metre contour interval.
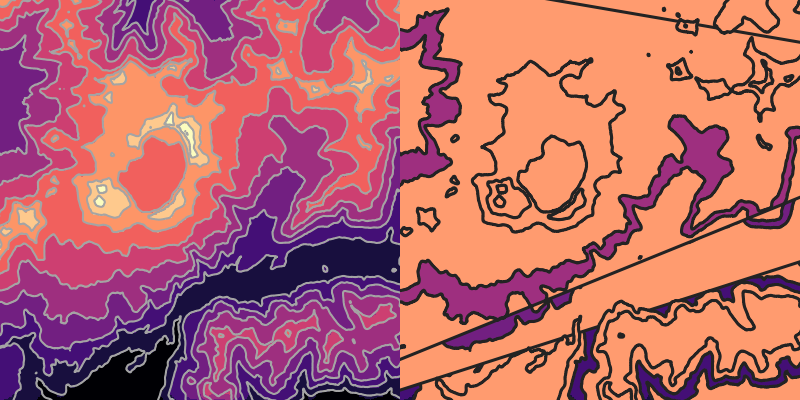 Left: The raster colour ramp has been changed from continuous to discrete colours, giving the impression of filled contours. Right: Attempting to use the
 Lines to polygons function leads to incorrect results wherever the contour lines intersect the edge of the image.
This is already quite close to a filled-contour map, except that the colours between the contours are not constant. This makes it harder to distinguish between the different contour levels. To approximate filled contours, we can apply a discrete colour ramp in the raster layer’s symbology. By choosing Interpolation > Discrete, Min: 0, Max: 2000, Mode: Equal interval and Classes: 10, the raster will appear as bands of colour which align with our contours.
The raster approximation to filled contours is probably good enough for most purposes. However, in some cases it is better to have true filled contours, represented by vector polygons. These will look better under high magnification, have useful geometric properties, and in some cases lead to smaller file sizes.
The solution is to convert the contour lines into polygons, using Vector > Geometry tools >Lines to polygons. However, the resulting polygons (shown here in orange) are usually incorrect. The major problem is that the algorithm does not know how to close the contour lines when they end at the edge of the raster. We’ll now see how to deal with this using a bit of Python code.
Filled contours with holes
For some unusual landscapes, such as volcanic craters, some of the contour lines have holes (enclosed regions of lower elevation). Holes can also be created by the tapering procedure described above. When contours have holes, the filled contours will not render properly, as the inner contour line is displayed simply as another filled polygon.
This problem can also be fixed in Python, by detecting the holes (contour lines completely enclosed by other contour lines of the same height) and ‘subtracting’ the inner contour from the outer one. The algorithm uses the areas of the polygons, so it is best to put the contours into a projected coordinate system (if they are not already) using Vector > Data Management Tools > Reproject Layer. For Katmai Volcano, UTM Zone 5N is a suitable projection.
The function to do this, find_contour_holes() can be found in my GitHub repository contour_helper, and used as follows:
python3 find_contour_holes.py contours_filled.gpkg contours_filled_no_holes.gpkg
Finishing touches
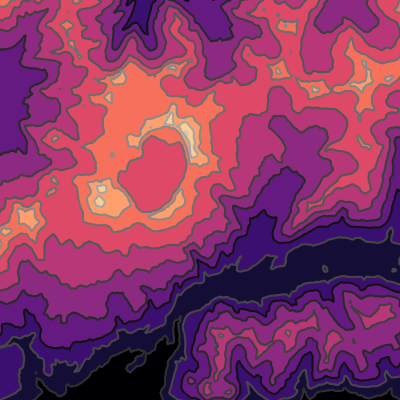 The final result of the steps described in this tutorial. The topographic raster has been converted to contours: discrete colour-filled vector polygons. The tapered region has been trimmed off, the contour holes have been subtracted, and the grey colours of the contour lines are adjusted to make the lower ones darker, achieving a constant contrast level even as the colours change.
If you tapered the raster, don’t forget to clip this region of the contours. You can do this by creating a new layer with a rectangle feature and applying
 Vector > Geoprocessing tools > Clip.
Controlling the symbology of the polygons from the QGIS menus can be tedious and restrictive. I sometimes use Python scripts to achieve a more automatic or fine-tuned result. For example, I like to adjust the brightness of contour lines (polygon outlines) to be similar to the brightness of the adjacent contour colours. This leads to contours that are always visible but never too heavy.
If you’d like to apply this kind of styling to your own maps, or see how it works, you can download and modify the Python scripts from my GitHub repository qgis_style. Here I used the function make_style_files() with the following input file:task make_filled_contours
z_min 0.0
d_z 200.0
n_bins 10
colour_ramp_type pyplot_linear
pyplot_ramp_name magma
outline_contrast 0.15
outline_style solid
outline_width 2.0
outline_width_unit Pixel
dir_out styles/
qgis_version 3.22.9-Białowieża
style_file_name filled_contours
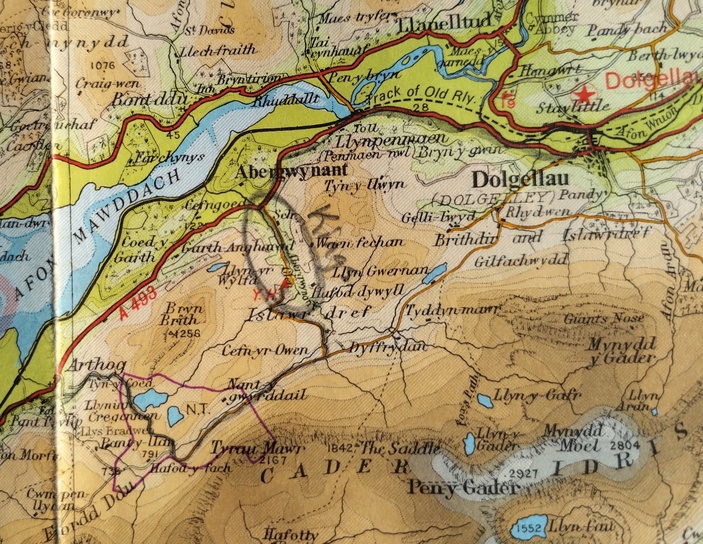 A portion of a map showing the topography with colour-filled contours (hypsometric tints). My cycle route is shown in pencil. I stayed at Kings Youth Hostel near Dolgellau and walked up Cader Idris. From Bartholomew Half-Inch Map Series 22 (Mid Wales), 1973.
When I was 19, I had my first solo adventure: a 1,001-mile (1,611-km) bike ride around Wales. I planned and navigated with Bartholomew maps, which my father had bought for 30 pence each in the early 1970s. Even though Wales doesn’t change fast, they were a bit out of date: some towns had grown, and a few bridges had vanished. But they had one major advantage: the topography was shown in colour, using filled contours. These hypsometric colours were pioneered by John Bartholomew Junior the 1800s. They made it easy for me to visualise the landscape and plan a route that was not too hilly.

