Article publication date: 19th March 2025.
Last updated: 21st April 2025.
You might have seen lots of photos of the aurora borealis (Northern Lights) recently, even quite far south. This is because the Sun’s activity is reaching a maximum in a roughly 11-year cycle. So, now is a good time to try to see the aurora. With summer fast approaching, I didn’t want to miss out, and I decided to try to pinpoint the best places to visit, using my past scientific experience working on a computer model of the aurora at the British Antarctic Survey. Here I’ll show what I found.
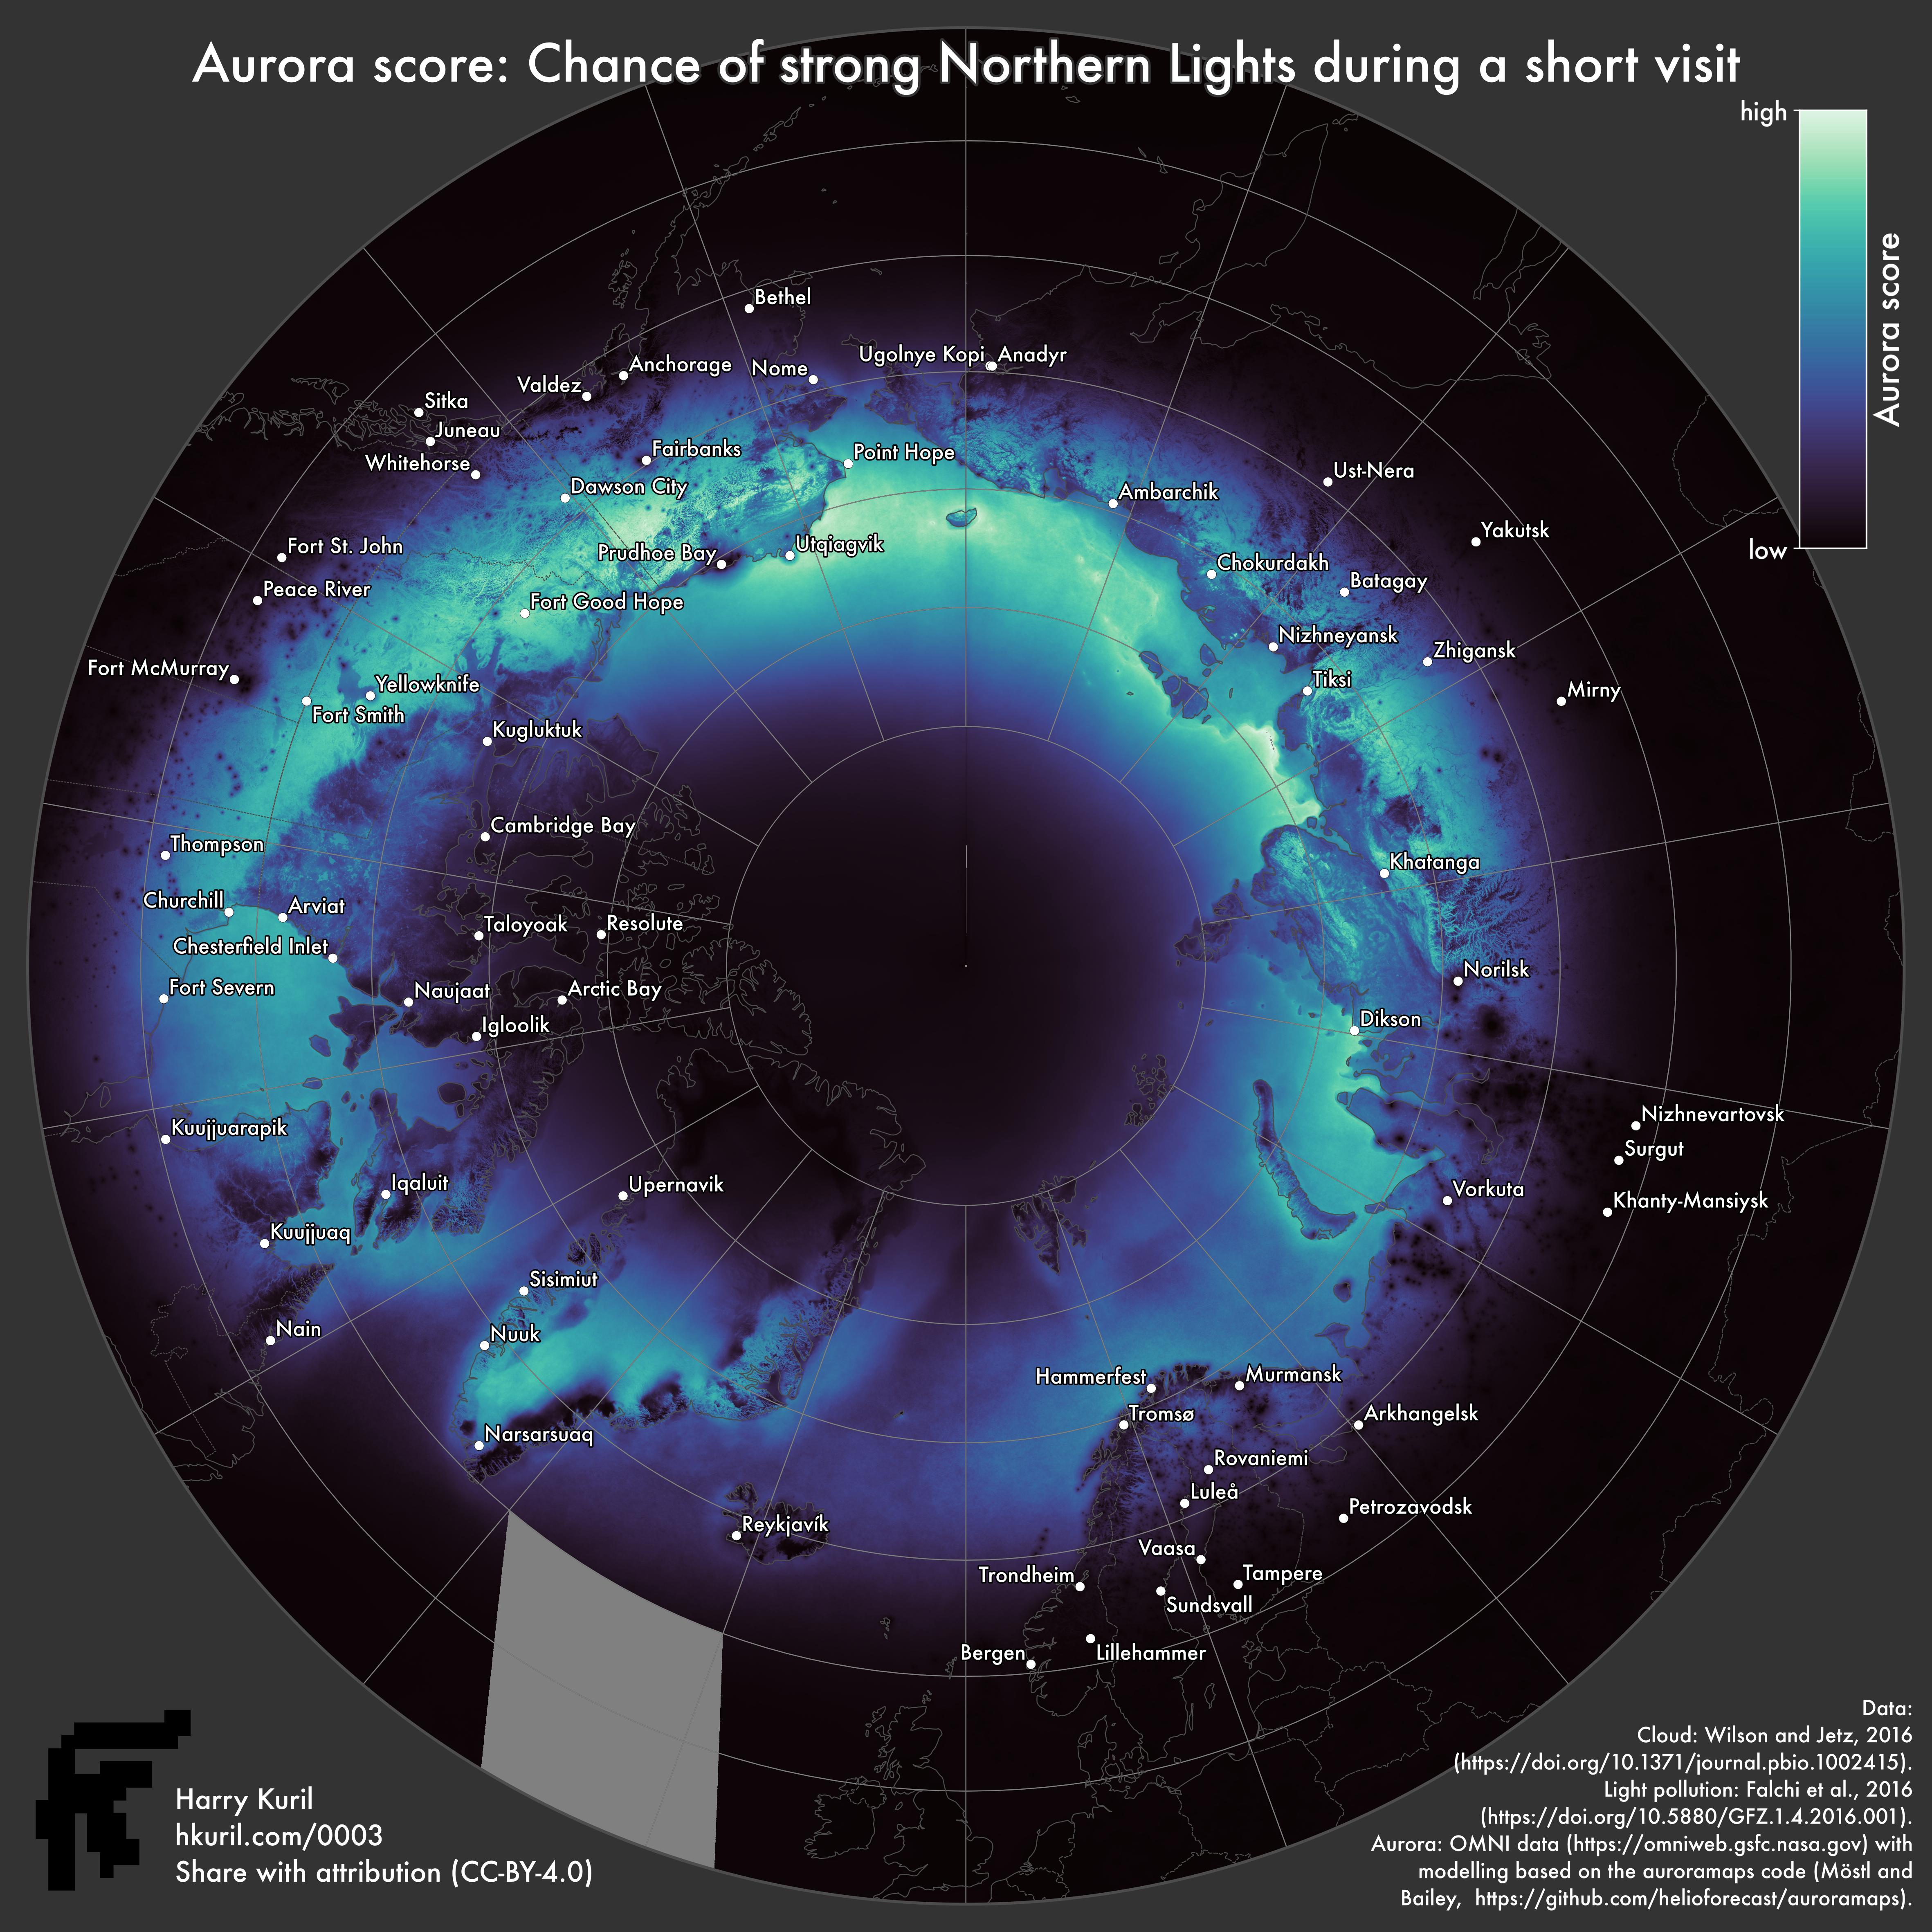
My goal was to identify the regions with the best chance of seeing strong Northern Lights during a short trip. I did this by combining three maps: 1) the mean strength of the aurora in the past couple of months; 2) the probability of cloudy sky, based on historical data; and 3) light pollution (logarithmic). Mathematically speaking, I take these three variables, normalise them between 0 and 1, and take their product, so the score also ranges between 0 and 1. Regions with a high score have regular strong aurorae, low light pollution and low chance of clouds.
Caveats
I wanted to finish this investigation before planning a trip for the Spring Equinox, so it was done in a hurry. There are probably some mistakes. My approach was ad hoc: I didn’t know whether these three factors were the best predictors, or whether I combined them in an appropriate way. I received feedback from the online community, including aurora experts, and perhaps the most important point was this: the mean aurora strength is not the best measure of aurora viewing quality, because the auroral ring is pushed southwards during the auroral storms, when the most spectacular displays are visible. At some point, I’d like to re-visit these maps to take that into account.
If you have any further comments on the approach presented here, please contact me or leave a comment below. What’s certain is you can still have a disappointing night of clouds or low activity in an area with a high ‘aurora score’, and in an area of low score you could still see an amazing display. In the Carrington Event of 1859, people even saw the aurora down by the equator.
The results
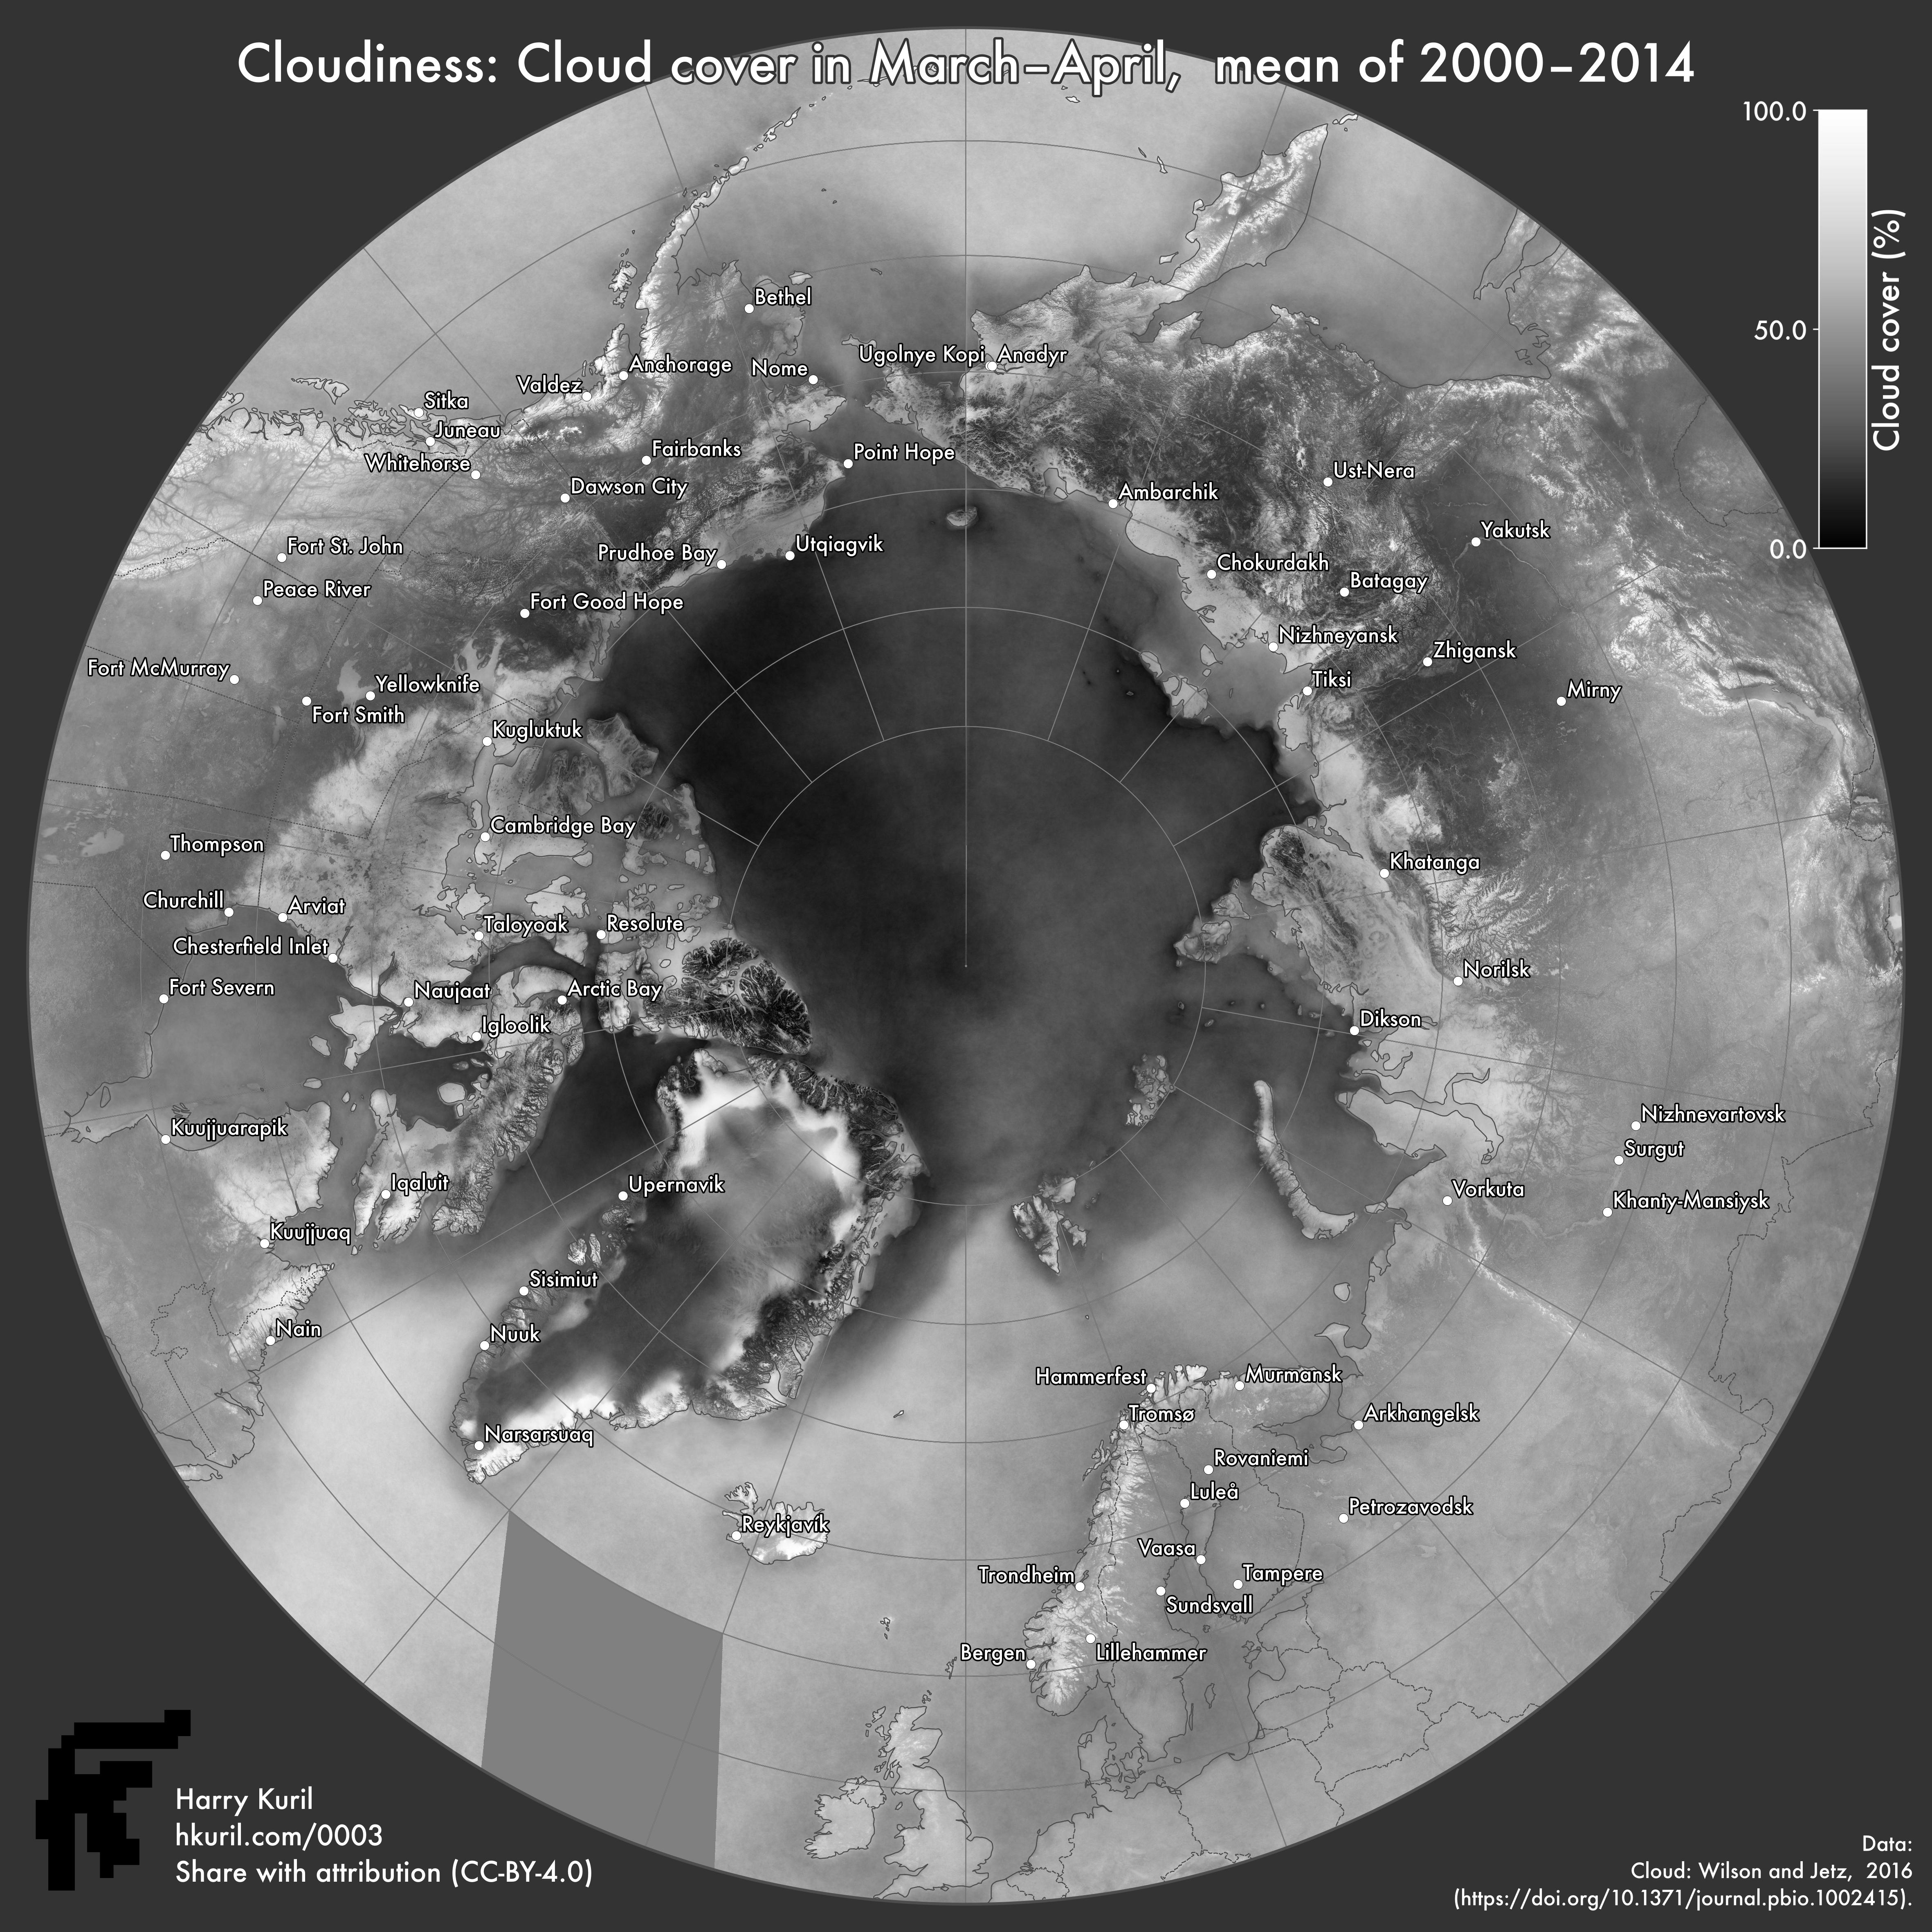
Cloud cover
A map showing the historical percentage of cloudy days in March and April around the North Pole. Higher resolution.
If the sky is clouded over, you won’t be able to see the Northern Lights. I got the cloud cover from EarthEnv, which hosts data from a 2016 paper by Wilson and Jetz. It’s the highest-resolution dataset of the three, because cloudiness can vary significantly over a short distance. So, try to dig into this data to make sure your target spot isn’t in the cloud shadow of a mountain range. Often the cloudiest areas are where oceanic air is usually moving onto land, especially mountains.
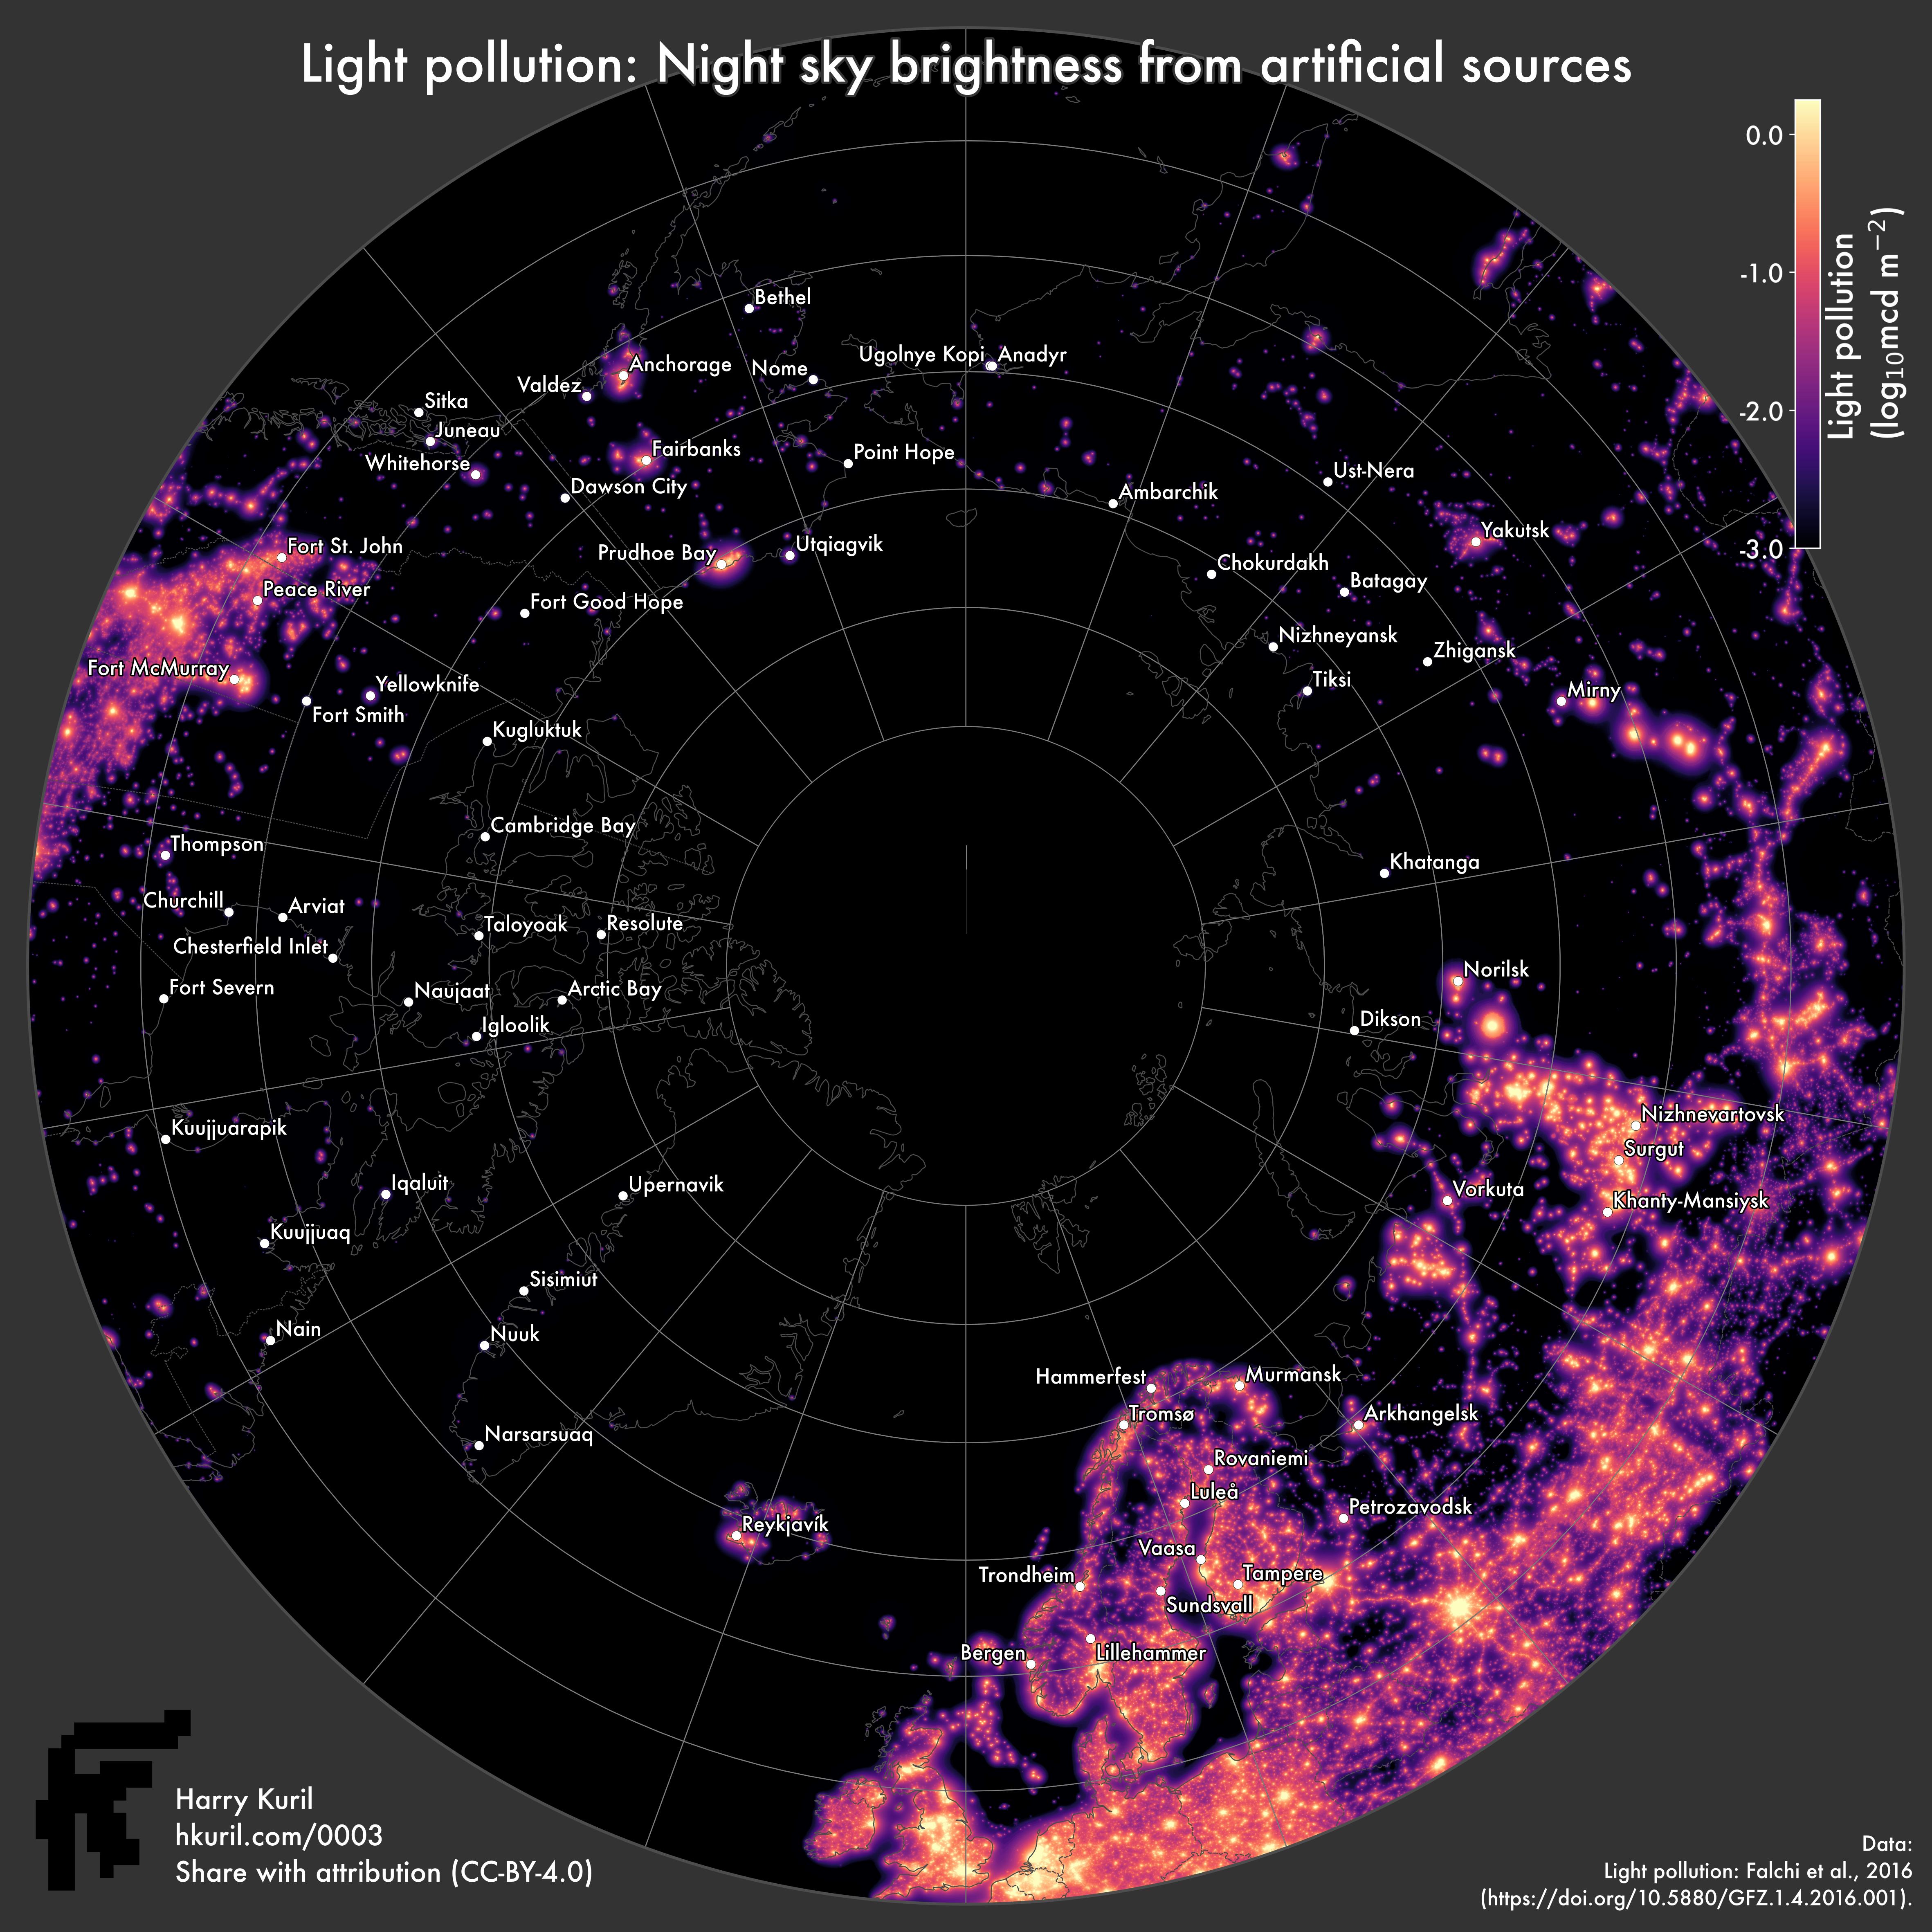
Light pollution
A map showing light pollution around the North Pole. Higher resolution.
I downloaded light pollution data from The New World Atlas of Artificial Night Sky Brightness which is a 2016 work by scientists Fabio Falchi et al. Unsurprisingly, light pollution decreases away from inhabited areas. Some resources suggest that a little bit of light pollution isn’t too important during a strong aurora, and can even help boost your colour vision, but you certainly want to get away from city lights. Note this data doesn’t account for natural light sources, such as the Moon—I discuss the Moon below.
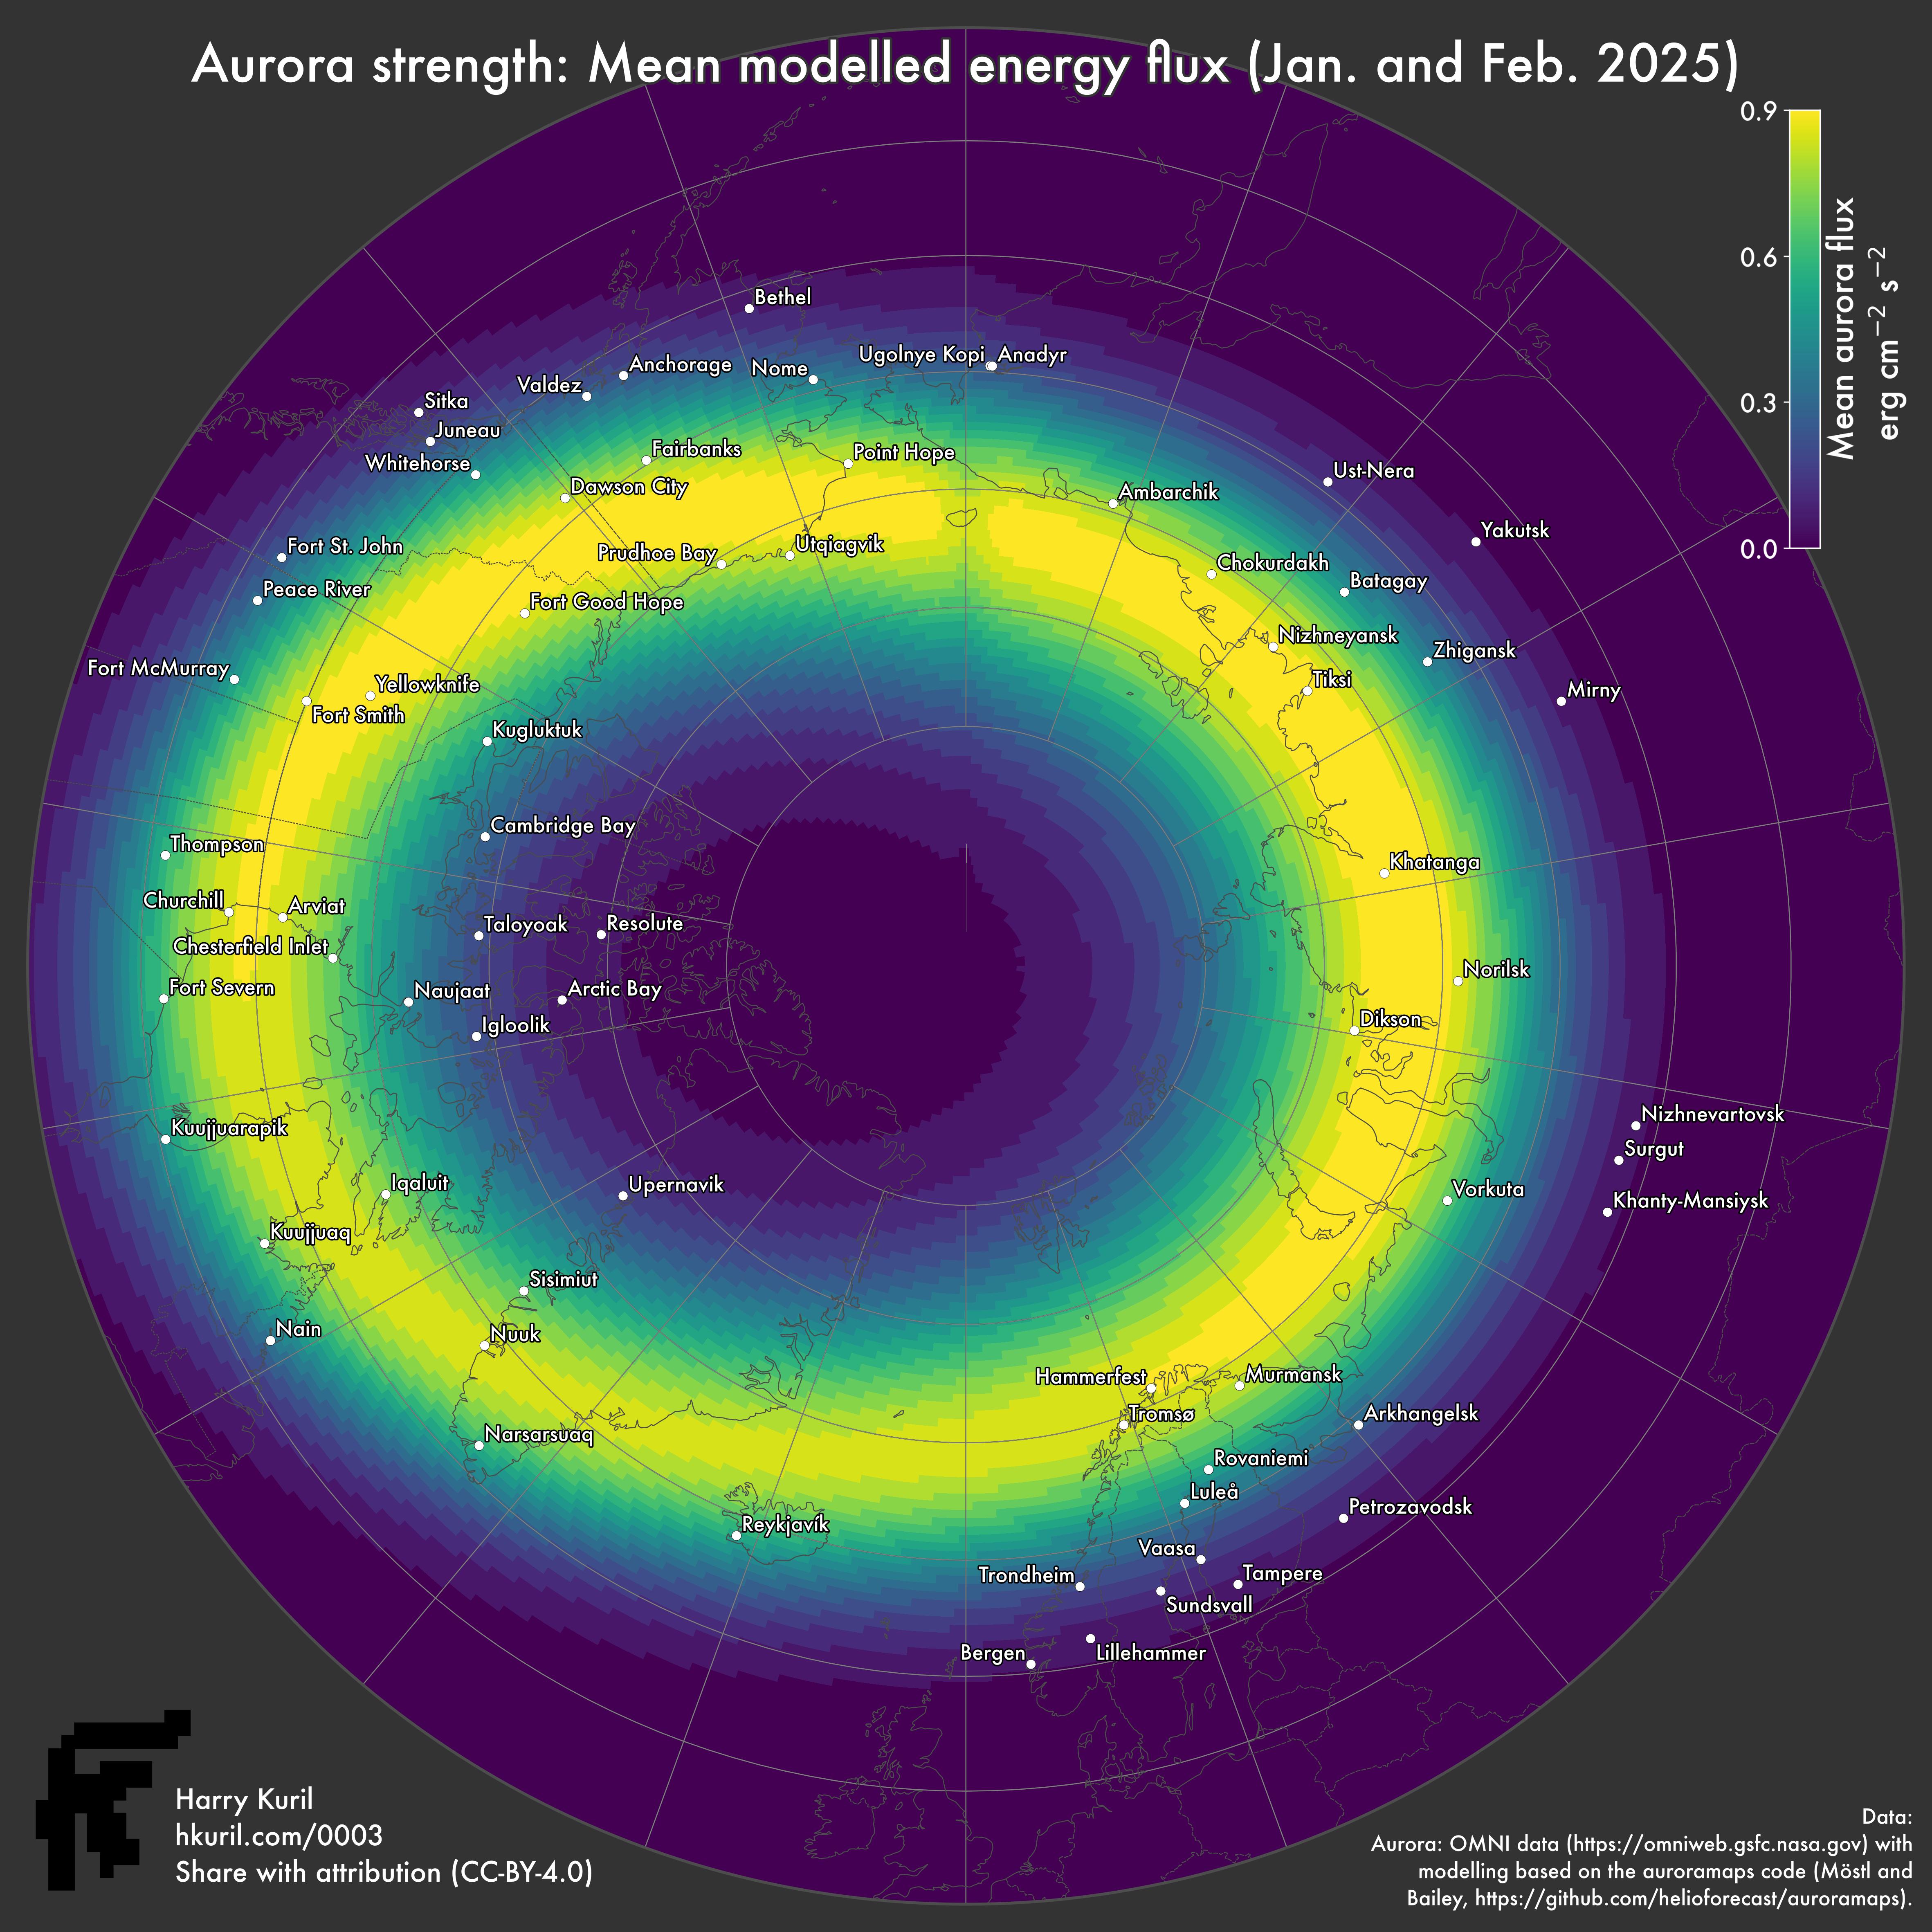
Aurora strength
A map showing the mean strength of the aurora in recent times. Higher resolution.
I found some open-source computer code online called auroramaps which makes maps of aurora intensity, based on modelling and extrapolation of satellite observations. This code was written by scientists Möstl and Bailey working at the Austrian Space Weather Office, based on a model called OVATION, developed by government meteorological organisations in the UK (MetOffice) and USA (NOAA). The satellite observations come from the OMNI 2 dataset gathered by multiple satellites under the auspices of NASA’s Space Physics Data Facility; for more information click here.
The pattern of the aurora is controlled by the Earth’s magnetic field, which changes over months. This is because the magnetic field is produced by Earth’s outer core of liquid metal, which is rapidly churning. Currently, you can see that the ring of strong auroral activity goes much further south in North America than in Europe. The aurora is also weak around the North Pole.
Overall ‘aurora score’
A map showing the ‘aurora score’ around the North Pole. This metric is intended to identify regions which give the best chance of viewing the aurora borealis, based on light pollution, cloudiness, and the strength of the Northern Lights. Higher resolution.
I calculated an ‘aurora score’ by multiplying these variables together. The best places on land seem to be southern Greenland, a swathe of inland Canada and Alaska, and northern Siberia.
Other factors and resources
The Moon
The Moon can brighten the sky and make it harder to see the aurora, although (as noted above), if the aurora is really strong, it probably won‘t matter. You can use timeanddate.com to work out when the Moon will be dim, or below the horizon. In high latitudes, the Moon can stay above or below the horizon for days on end.
Time of year
Some resources suggest that the strength of the aurora peaks around the equinoxes, although I haven’t had time to fully investigate this. The equinoxes can be nicer because there is still daylight to carry out other activities. During summer, the Sun won’t really set so it won’t get dark enough to see the aurora.
Time of day
The aurora does have daily patterns. A lot of resources suggest that 10 PM to 2 AM is the best time, but I haven’t had time to investigate this further.
Aurora forecasts
Aurora can be forecast a few days in advance, based on observations of solar flares. One example uses the OVATION model (mentioned above) and can be viewed here. For Iceland, the weather service provides a combined cloud and aurora forecast, which makes planning easier.
Weather forecasts
The website ClearOutside.com provides weather forecasts tailored for astronomers. The focus on cloud cover is very useful.
The Aurora Guy: Advice on the aurora and background information, for example on what the aurora looks like by eye, versus a camera.
What about the aurora australis (Southern Lights)?
Of course, the aurora occurs around the South Pole as well. I just haven’t had time to look into it. Some aurora models only apply to the Northern Hemisphere, partly because much of the southern auroral zone is over ocean or uninhabited land.
What I decided to do
At the time of writing, I was based in Europe, so I decided to book onto a three-night boat cruise around the tip of Norway, on the Hurtigruten state ferry. I was optimistic that I might see some aurora, even though my maps suggested I had a high chance of encountering cloud. Some promising signs were that the moon was hidden, and it was almost equinox.
However, I should have trusted my maps! It was mostly too cloudy to see anything. We did have some showings of big but faint aurora. The Hurtigruten wasn’t a very good place for viewing, because they don’t turn off their bright lights on deck. There were also dozens of people scurrying around taking endless photos, instead of watching the patterns shifting. In future, I’ll try somewhere with less chance of cloud, and lower light pollution. Follow me if you don’t want to miss future updates.
Update history
21st April 2025: Added information about community feedback and Norway trip.


